After almost two years of frustratingly slow progress, the DevOps transformation leaders at MIB (Massive Investment Bank, whose name is interesting but not important) are re-evaluating their choice of key performance indicators (KPIs). They’ve been using just two Agile metrics to measure DevOps progress, the number of releases made per month and the number of incidents raised per month.
In this essay I explain the reasoning behind these measures and why the practices that influence them, especially batch size, play such an important part in the often-overlooked foundation step of any Lean, Agile or DevOps transformation. In the tech transformation business, the cliché holds, that the first step is the hardest and many large organisations fail because they underestimate the importance of getting the basics right, thinking they are already far more competent than they really are, and set-off setting-off determinedly in a dangerous direction.
Releases and Incidents as KPIs
I’ve written before in the executive challenge about why MIB’s CIO chose these two KPIs from the eight DevOps metrics that the management consulting firm insisted were necessary. Essentially it’s because they are associated with levers that allow managers and teams to focus on the smallest thing that will really make a difference.
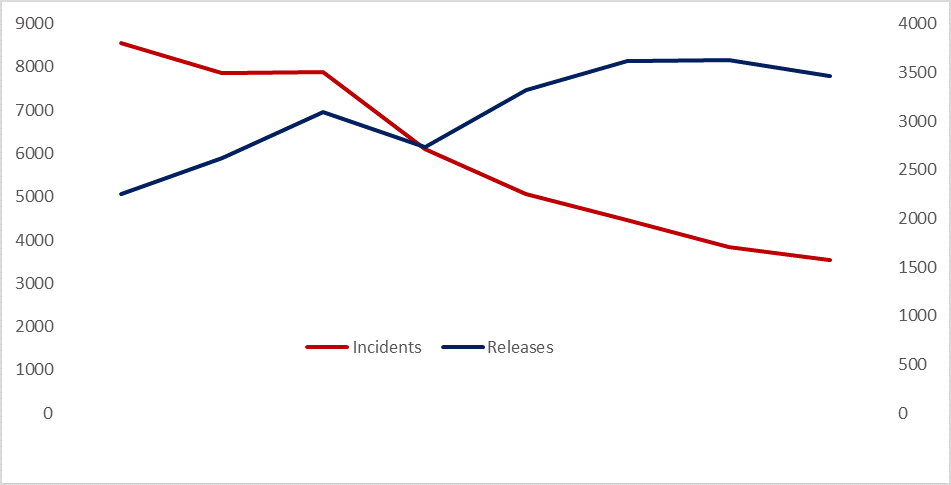
Even as I write, people are arguing to add other DevOps metrics such as mean time to recover from failure, changing the metrics to measure business value, and even to convert the metrics into a big stick by tying them into executive’s bonus pay calculation. There is value in each of these suggestions of course, and they are driven by a desire to keep the KPI dials moving, which they did for most of the year. The chart below shows indicative numbers (made-up for the purposes of publication) and the all-important positive jaws achieved in the year to September.

Figure 1 Indicative figures showing positive jaws of DevOps metrics: releases vs incidents
In that period, staff have been fed a rich and varied diet of DevOps, Lean and Agile brain food, including senior stakeholder interventions by Mary and Tom Poppendieck, who could have written her Cost Centre Trap essay for MIB, as well as other Lean Agile dignitaries. They’ve had a dozen coaches working full-time, lots of community leadership, communities of practice, roadshows, conferences, a new top-down target operating model and bottom-up encouragement. The indicators moved quite a long way in the right direction, then settled-back. Now the transformation leaders want something to present to the CIO that involves numbers and a plan. ‘Progress is going as well as can be expected’ is fine as an elevator conversation, but it won’t convince the steering committee who are being asked to approve the budget for next year.
DevOps Metrics #1 - Release frequency
The first research question of the State of DevOps survey run annually by DevOps Research and Assessment establishes Deployment frequency by asking “For the primary application or service you work on, how often does your organization deploy code?” MIB measures the exact same thing, and is able to do it reliably and automatically. A good choice it would seem.
Release rate is an ‘in your face’ measure and surely, if teams are failing to deliver code to production, then they are failing to meet their primary purpose. It matches the first principle of the Agile Manifesto too: “Our highest priority is to satisfy the customer through early and continuous delivery of working software”. Like the kitchen staff of a restaurant, the delivery team produces the plates of food that the front of house sells. No food, no “bill please waiter”, and no revenue. It doesn’t matter how wonderful the culture, or how many orders the waiters receive, if the kitchen fails to deliver food on plates, then it’s game over. And yes, you should expect more restaurant metaphors if you choose to follow my articles and posts.
A Trailing Indicator
Release frequency is a trailing indicator. It is affected by several critical factors that have already had an effect, which is why it should remain an indicator rather than be used as a target metric. Nobody wants to see managers telling teams to increase their releases just to make their DevOps metrics look good, and thus far it hasn’t happened. On the other hand, there have been no incentives either to encourage MIB’s senior managers to increase release rates within their areas of individual responsibility.
As a measurement taken at the end of the process and based on the cumulative results of the process, a high release frequency suggests the team is practising Lean product management. That translates to: small batch sizes, effective feedback and adaptation practices, and automation of repetitive tasks according to Nicole Forsgren’s research.
Leading the State of DevOps survey, Forsgren reveals that high performing organisations “split work into small batches and made visible the flow of work through the delivery process”. Her research also found that high-performance was associated with “gathering, broadcasting and implementing customer feedback and giving development teams the authority to create and change specifications as part of the development process, without requiring approval.”
Forsgren uses four DevOps metrics to evaluate performance:
- the speed at which changes can be delivered into production;
- the lead time to get a change into production;
- the mean time to recover from an incident;
- the percentage of change-related incidents.
Every one of these is important and potentially valuable through inspection and adaptation yet, given the absence of any other reliable data in an IT department that doesn’t always understand its own software development processes, tracking release frequency and incident rate and sharing that info at team, manager and programme level is the barest minimum way to introduce empirical data and transparency. Senior managers, who do need to be taught about, and told why they should care about these indicators, can then more easily recognise teams that are unstable and need attention, from teams that are predictable and improving. Remember, the goal of the first stage of transformation is Predictable and Agile Delivery and that predictability is highly influenced by the ability to split work into small batch sizes.
Small Batch Sizes are Critical
‘The best way to do a massive task is to break it down into several smaller ones’ sums-up the common-sense wisdom, that will get you to the right result, but it doesn’t explain why. If Sinek (start with WHY, then WHAT and HOW) and Pink (motivation depends on purpose, mastery and autonomy) are correct, then people who know WHY they are doing things are likely to be more highly motivated. We coach managers to develop their competency to understand WHY small batch sizes are so important, so they can better serve their teams, helping them to define the WHAT, and ensuring they are able to get-on with HOW, through self-organisation.
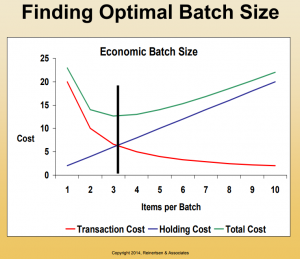
Small batch sizes therefore, or more usually, user stories that are small enough to be independent and valuable, balance the cost of releasing the story with the cost of delaying the release of that story. Don Reinertsen shows a graph like the one in figure 2 from FlowCon where the intersection of the two cost lines reveals the optimum batch size.

Figure 2 Finding optimal batch size (C) 2014 Reinertsen & Associates
The ‘sweet spot’ for batch size is quite wide, being the flat bottom of the total cost curve at the top of the chart. For this example, a batch size of between two to four is optimal and anything higher than five or six should be discouraged because total cost is too high.
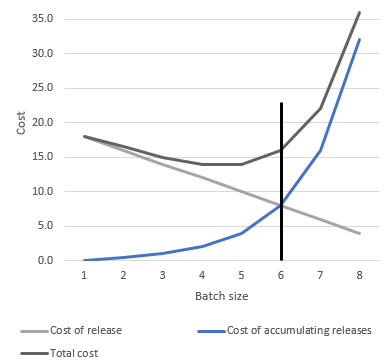
Yet when every release has to go through six weeks of testing, the transaction cost of running the release process is so high that smaller batches are economically prohibited and a larger batch size is inevitable. Unlike Reinertsen’s linear holding cost which is based on physical storage of manufactured inventory, each additional software change that is bundled into the same release increases complication and risk exponentially. The equivalent chart for MIB has a profile like the one shown in figure 3 below. The cost of releasing software is high and is reduced linearly by adding more items (stories) to the batch. The exponential line now is the cost of accumulating releases, which delays the moment of truth of discovering if the code that’s been changed actually works in production and, if not, where the impacts occur and how they can be mitigated.

Figure 3 Economic batch size for software releases
Essentially, the risk of incidents and the cost of recovery rises disproportionately with batch size. For a business obsessed with financial risk and staffed by some of the best mathematicians, it’s incredible that so many are blind to this risk. Small batches means a shorter time to wait to get vital information that can be used as feedback which is the basis of all agility.
The chart makes it obvious that reducing the cost of release would allow for a smaller batch size, and the black indicator line would move left. Forsgren shows something well-established in lean manufacturing, that high performance is achievable with smaller batch sizes.
Releases to production at MIB are still far too expensive. Banks are heavy with regulatory-driven process that is being simplified and automated, albeit slowly. Also, very poor definition of roles and lack of accountability have resulted in layers of manual approvals. One release process had more than a hundred approvers, which is typical of the sort of things discovered and able to be improved, on the journey of transformation.
High release transaction costs is a price that MIB must pay for years of a short-termist approach to tech; a legacy of monolithic applications, massive technical debt and convoluted, tightly-coupled architectures.
How would the MIB estate look were Elon Musk or Jeff Bezos to be in charge? Bezos allegedly sorted-out the architectural mess at Amazon’s AWS in a memo with the opening line “All teams will henceforth expose their data and functionality through service interfaces” and concluded with “Anyone who doesn’t do this will be fired. Thank you; have a nice day!”
Without the confidence and clarity of a Bezos and with key stakeholders insisting that everything has to be tested all together and then released all together because that’s their only experience, the DevOps argument is hard to sustain. Thus, release rate serves as an indicator, but to really understand how to effect change, managers should learn the importance of controlling batch size and how to manage the dynamics of flow.
Some examples illustrate Inertia and the Cost of Release
One team at MIB does four releases per year. They hold-back all their many user stories and then release them all at the same time in a single large batch. The administrative cost of the release, the labour to write the change requests and roll-back procedures and obtain the necessary approvals, when divided by the number of stories involved, is quite low. The business, their internal customer, is happy with this pace and does not want releases to be made any faster, so they apparently do not recognise any cost of delay. However, the negative impact of so much change is apparent from the numbers of incidents that it causes. Each incident has a cost and many of them reveal defects or improvements that could have been avoided. This is avoidable waste.
Another team has automated their release process. They did it as an improvement action following a retrospective and the realisation they were spending $50,000 a year just on release administration. They had built an automated integration pipeline and now wanted to do twenty times more releases, without incurring twenty times greater costs. By lowering their release costs significantly, they were able to release very small, non-breaking changes very quickly. They now release a thousand changes each month and their business customers could not be more delighted, describing themselves as an IT business rather than a banking function served by an IT department.
DevOps Metrics #2 - Incident rate
MIB’s incident DevOps metric includes all incidents, whether resulting from a release or not, and even if the incident is really just a user wanting IT’s help to find an Excel window which was somehow on screen five instead of where it was supposed to be. That’s somewhat unfair on the development teams, of course, but that’s deliberate in DevOps where Dev and Ops people are encouraged to work together instead of developers throwing their done work over to operations to release and support.
Incident numbers matter because they are a direct indicator of waste. Count the incidents, then count the defect rate arising from those incidents and interrupting the planned work of the development teams and you get an idea of how important they are. If you really want a shocking statistic, then estimate the cost to the business in frustration as well as lost trades; the cost of delaying the next feature whilst the Dev team fixes the previous one; the performance and quality impact of increasing the team’s WIP with unplanned work; and the operational cost of servicing the incident. This last is the only one that most banks track because the others are invisible to them. Support staff are paid from a special ‘run the bank’ (RTB) budget, so it’s easy to figure their cost as a function of their time.
Continuous improvement practictioners would ask if the incident revealed a recurring problem, and what improvements would prevent it from happening again. At MIB, nobody other than support staff have been much interested in incident rates and so it was refreshing to hear that a senior manager, the regional head, spent a day working on the support desk. Apparently, the customers rated him as very willing to help but found him “a little slow”.
Publishing the incident rate metric has had a sobering effect on teams, bringing-out their naturally competitive nature. Nobody wants their team to have the worst incident rate, so it has become more of a shared concern for support, development and infrastructure experts, collaboration has improved and the results show a healthy trend even if there is still a long way to go.
Summary
Reducing the cost of software releases allows the size of changes to production to be smaller, and smaller batch sizes allow faster information feedback loops. That feedback is needed to quickly expose bad assumptions and course-correct when things don’t go as expected. Smaller batches are directly linked to release frequency and the simplification of a small-sized release reduces the blast radius. There is less variability and complexity in a small release than a large one, lowering the probability of a change-related incident.
Batch size is so crucial to agility that it hardly matters what you do to reduce the size of the change being released, or why, whether based on Reinertsen’s mathematical proofs or just applying the DevOps principles of faith that smaller is safer, cheaper and faster.
The DevOps metrics of incident rate and release frequency are critical indicators, essential to an organisation that cannot reliably measure anything else. There is a danger that senior managers think they will be judged on the release rate metric and attempt to mask or manipulate it. Incident rates should be publicised for all development teams and their managers to see and to compare.
These DevOps metrics represent two, or perhaps one and a half of the four measures used in The State of DevOps survey to assess delivery outcomes. You can download the State of DevOps 2017 report, infographic, or view the key findings webinar.
It’s almost the end of the calendar year, which is always a good time to retrospect, and MIB have a new official senior sponsor, one who until very recently, practiced Agile and DevOps. The board approved a lower budget so the transformation journey will continue, leaner and wiser and with two key performance indicators.
Bibliography
Forsgren, Nicole; Humble, Jez; Kim, Will; Brown, & Kersten. State of DevOps, 2017
Forsgren, Humble, & Kim. The Science Behind DevOps. 2017
Reinertsen, Don. Principles of Product Development Flow, 2009


